Bringing you architectural intelligence everyday - September Product Update
Use Comper to understand your codebase in realtime This month, we're introducing a whole host of new capabilities across Comper to close the loop between architectural intelligence and everyday engineering execution. Software architecture documentation frequently goes stale, code reviews miss cross-system side effects, and tracking critical user journeys across microservices remains fragmented. Together, these updates represent the next step in building an architecture platform that keeps codebases aligned and empowers engineering teams to build with clarity.
Super Fast Agentic Code Reviews - Build with ease and speed
Pull Request Reviews are the new bottleneck. Understanding your codebase is half the battle; the other half is applying that knowledge before bad changes land in production. Our customers have been asking for this feature and we have now expanded our change request intelligence into an active, conversational Change Request Agent capable of extremely fast and accurate code reviews.
Context-Aware Automated PR Reviews: Our new service reviews against your entire architecture not just a single repo, flagging cross-repository breaking changes, historical churn risks, and boundary violations directly in line. Due to the underlying Comper engine context we are 5x to 10x faster (and cheaper) than Github co-pilot.
Interactive Review Threads: Reply directly to feedback to request alternate refactors, evaluate architectural trade-offs, or check performance impact in real time, giving you control and true understanding of the impact of AI generated code changes
Granular Repository Controls: Configure automated checks globally or tune review rules per service repo to fit your team's workflow.
Engineers: Catch cross-repo breaking changes and architecture rule violations before CI fails or code lands in main.
Product Managers: Accelerate PR cycle times and reduce launch delays caused by review bottlenecks.
Engineering Leadership & CPOs: Enforce organization-wide architectural standards consistently without burdening senior engineers with repetitive review tasks.
Interactive Architecture Diagrams Updated
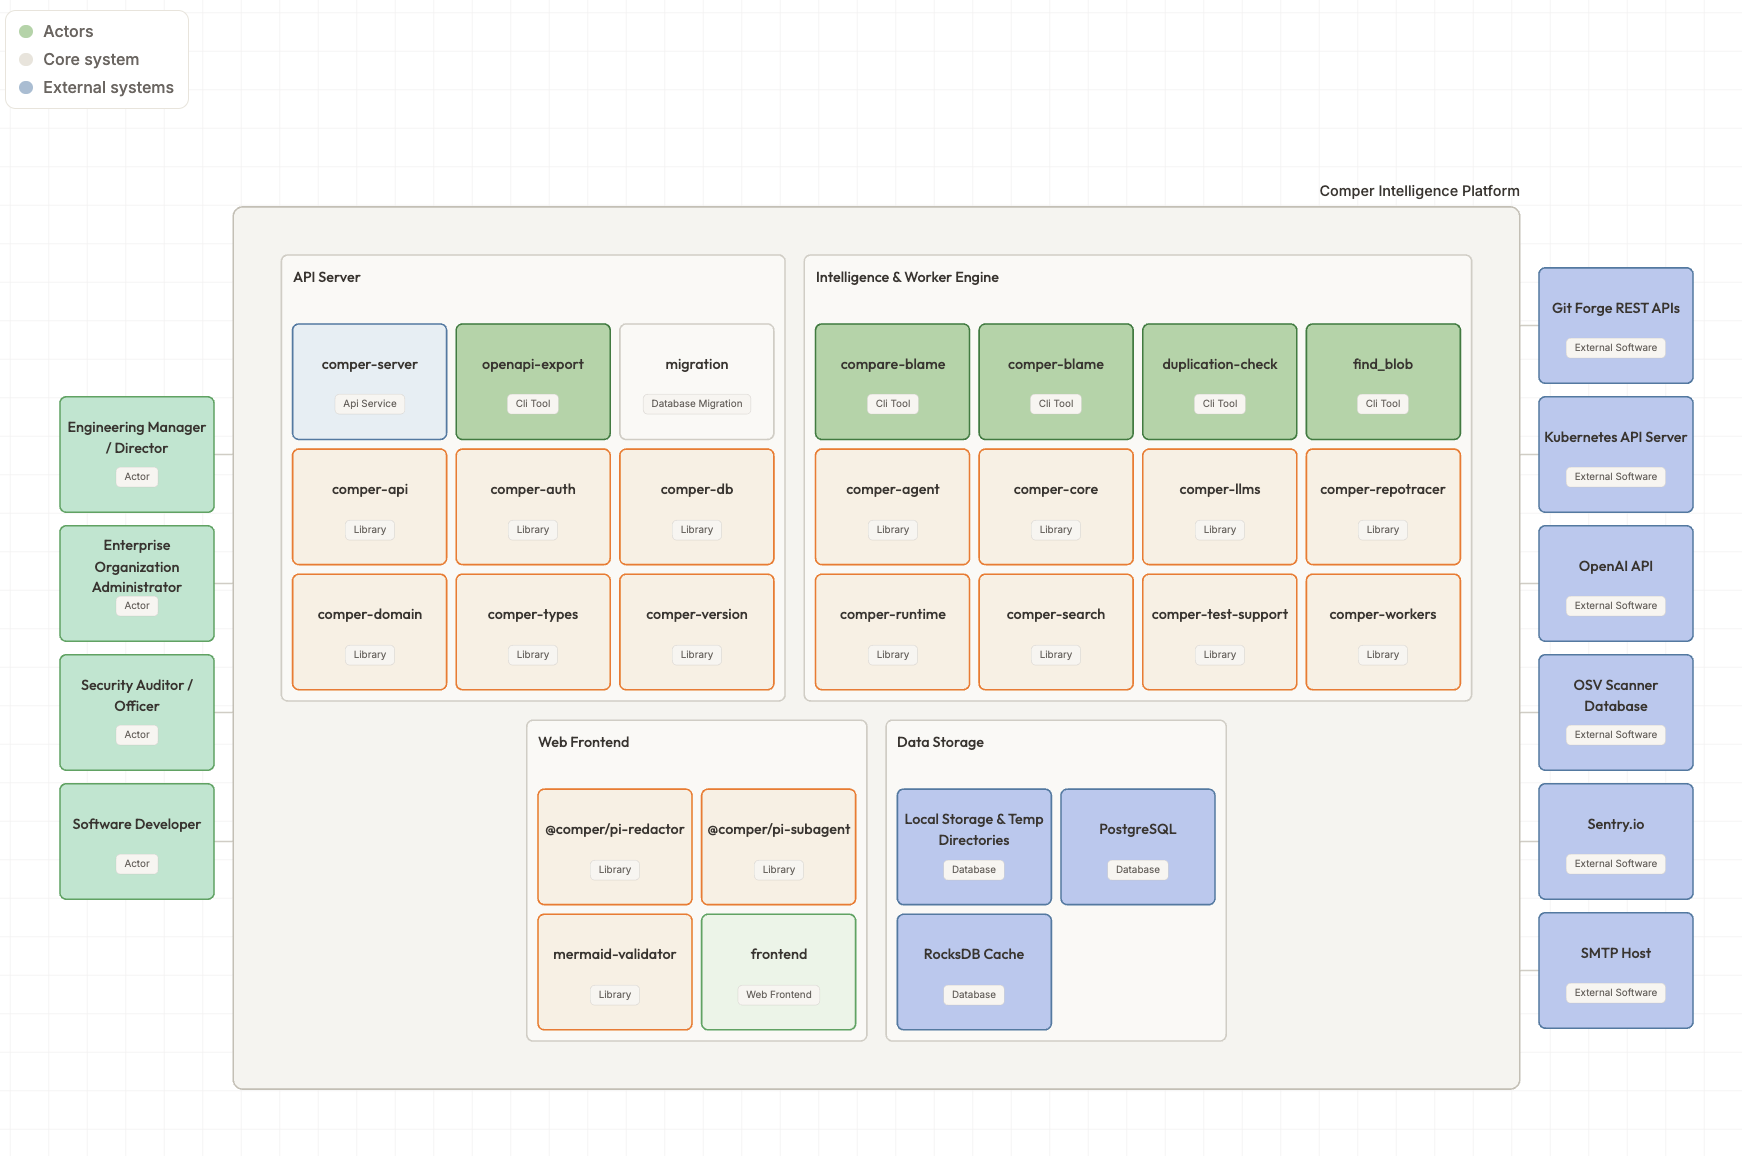
Earlier this year, we introduced high-level Architectural System Landscape diagrams to map software boundaries. Now, we're completing the rollout of interactive Container Diagrams within them, giving teams a clear view into the internal operational topology of their applications.
Where before we just mapped the high-level software boundaries, we know let you inspect the internal operational topology of your applications:
Automated Service Topology: Our living diagram, always updated with every commit maps services, background workers, web apps, and datastores straight from source code, giving engineers immediate visual clarity into system dependencies and helps with accelerating developer onboarding.
Data Boundaries & Storage Contexts: Groups databases, caches, and queues into explicit architectural boundaries so teams can easily assess blast radius and prevent unexpected data coupling.
Engineers can now instantly navigate unknown codebases, understand container boundaries, and trace data dependencies during feature development.
Interactive diagrams empower Product Managers to visualize system components to accurately estimate technical scope and dependency risks during sprint planning.
Engineering Leadership & CPOs: Leadership can easily gain complete visibility into their service setup and eliminate single-point-of-failure blind spots across applications.
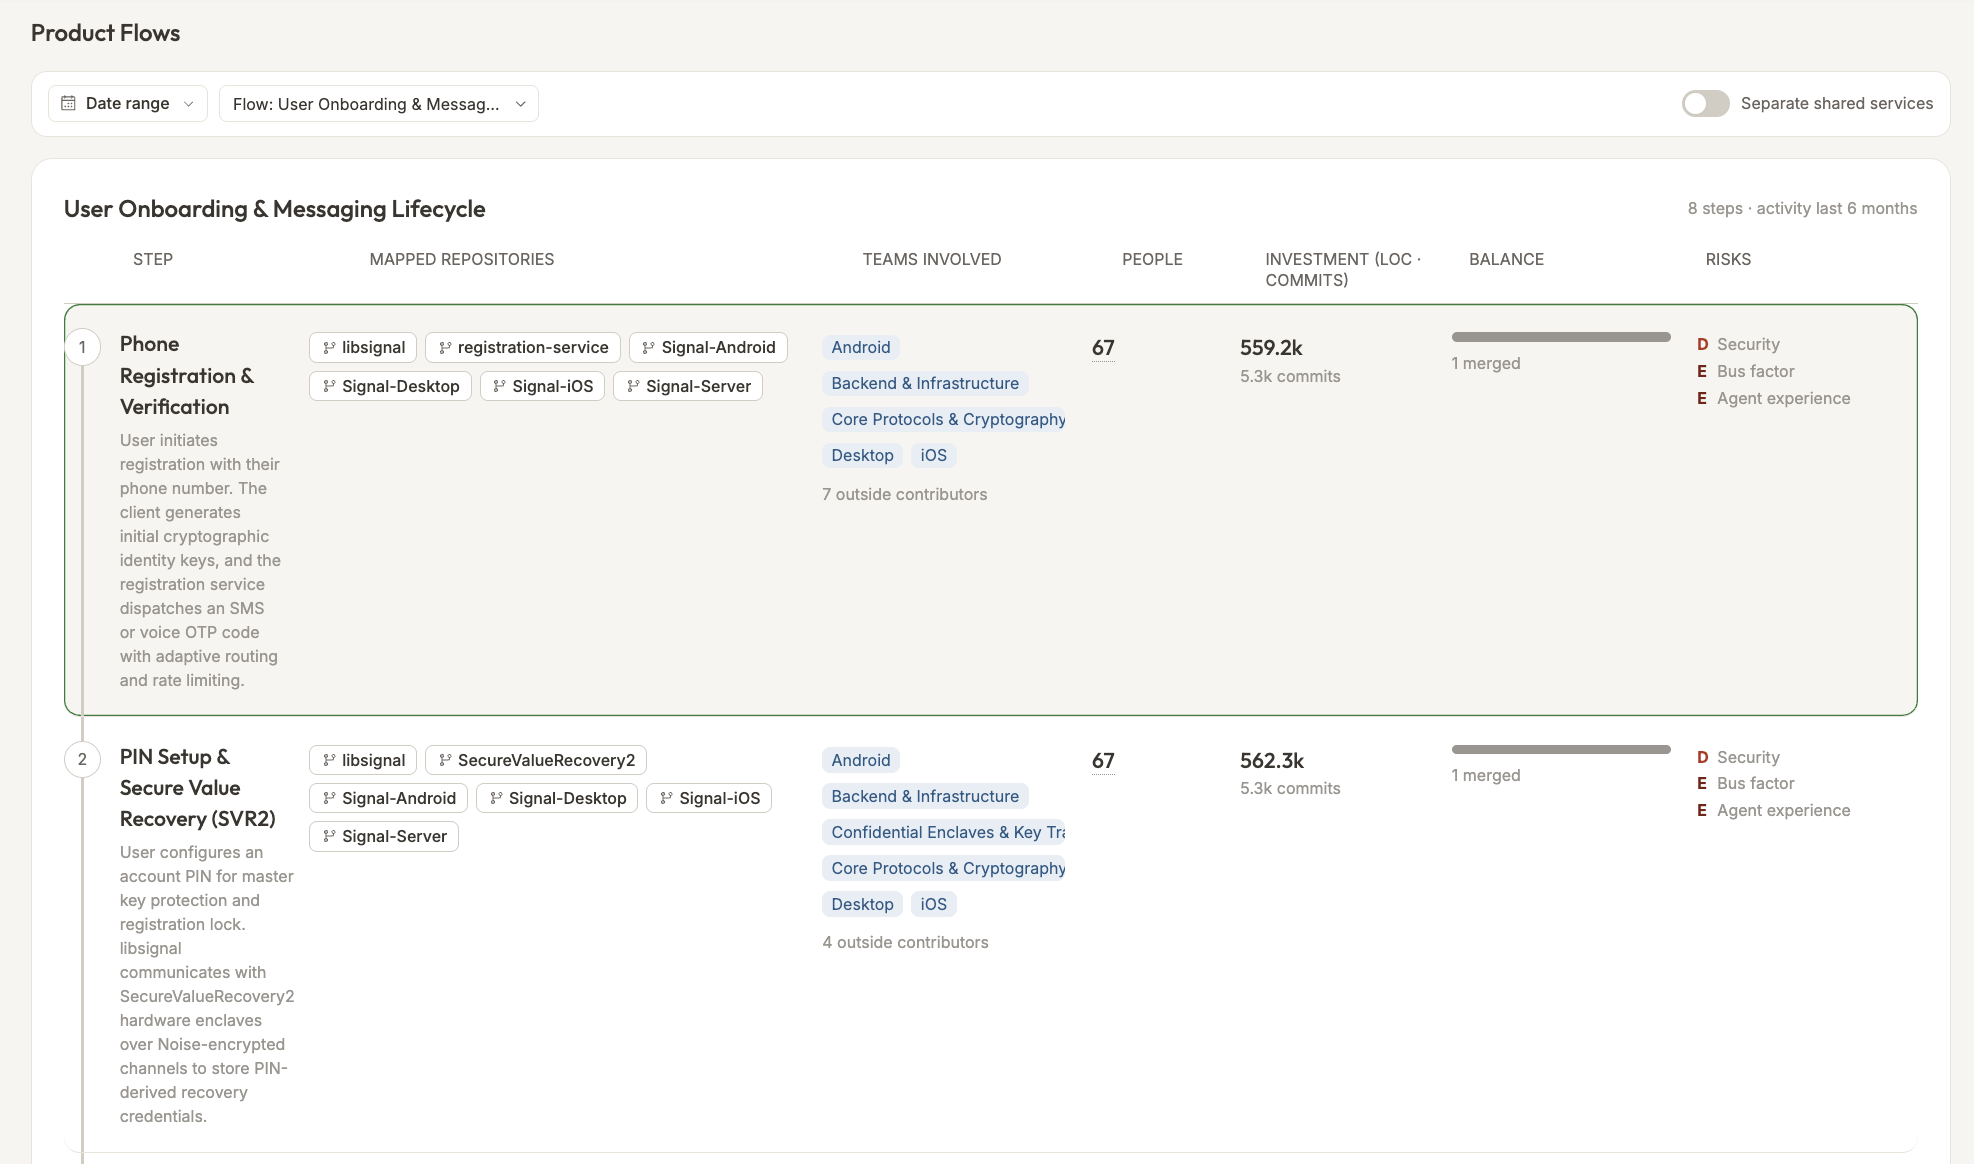
Product Flows: End-to-End User Journey & Risk Mapping
Modern features rarely touch a single repository. A single checkout flow or user authentication lifecycle might span a mobile client, API gateway, payments service, and asynchronous event workers.
Product Flows transforms these distributed pathways into an intuitive visual timeline:
User journey stages line up with Architectural Risk Overlay: You can now trace every stage in a user flow across multiple services, with critical architectural bottlenecks, single points of failure, and unmaintained components flagged directly on the timeline. Seeing your money making functional flows directly mapped to the code that powers them.
Pillar & Per-Repo Risk Breakdowns: Open the step drawer to see exact blast radii, contributor histories, and security risk factors broken down repository by repository.
Team & Contributor Awareness: Identify at a glance which engineering squads own each step of the flow, who is actively committing to those systems, and where ownership gaps exist.
Engineers can pinpoint the exact service or dependency causing an outage or bottleneck in critical user journeys.
Product Managers: Align your user story directly to the multi-service systems executing your product. This means you can track feature risks across teams and services in the language you understand - the user flows.
Engineering Leadership & CPOs: Evaluate systemic architectural risk across core business workflows to guide strategic tech debt investments.
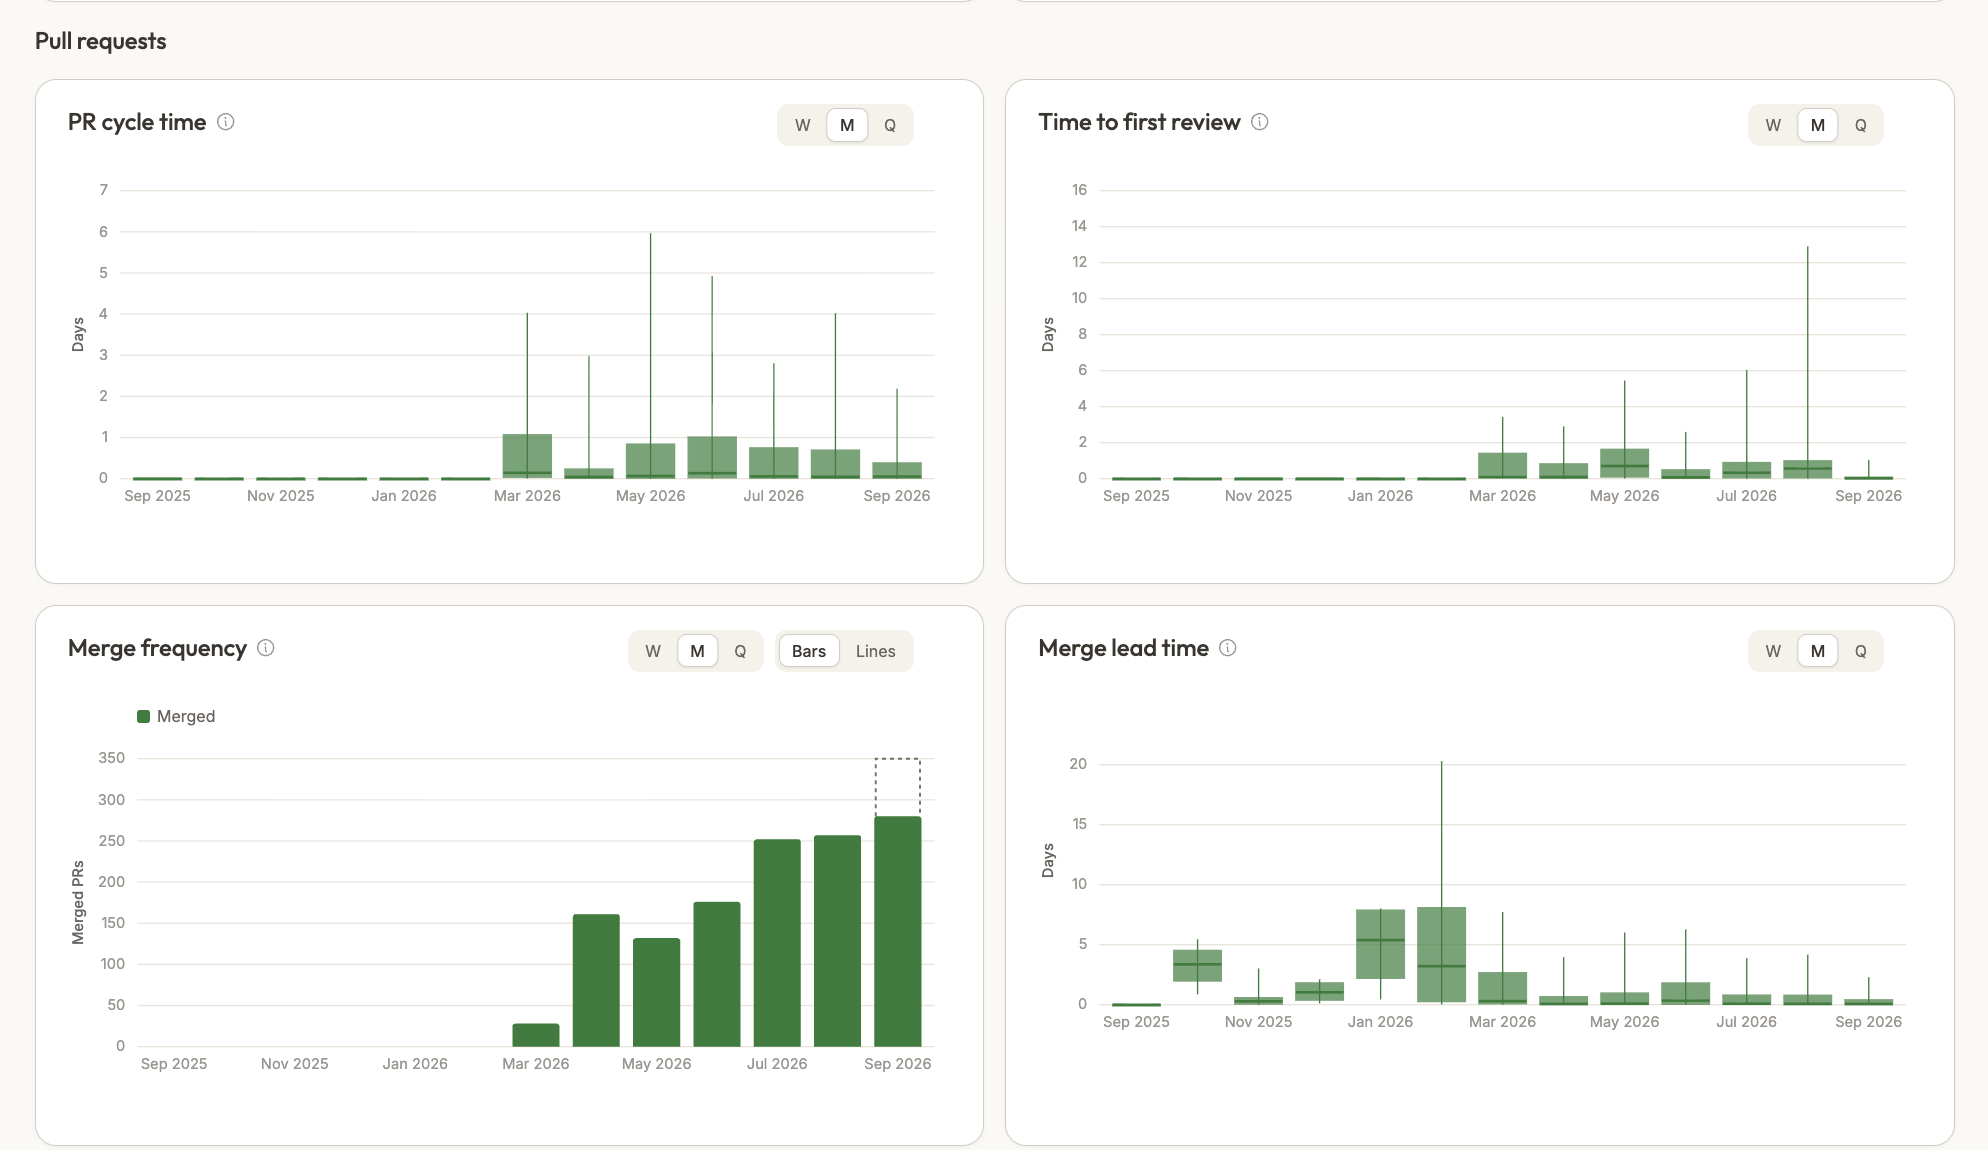
Smarter Dashboards: Scoped Release Summaries & Productivity Metrics
Engineering leaders and product managers need immediate visibility into what was actually built, shipped, and modified without sifting through hundreds of commit hashes.
Dynamic In-Scope Release Notes: The Release Dashboard now includes an automatically summarized release notes widget that dynamically updates based on your active filters. Filter by team, repo, or milestone, and get an executive summary of new functionality, fixes, and architectural adjustments. Keeping you up to date with the latest changes effortlessly.
Rewrite vs. Comment Ratios: We’ve added code rewrite rates and review comment volume widgets to the Productivity Dashboard to help teams monitor code churn and review engagement, this is extremely important to monitor in the agentic SDLC.
Direct CVE & Vulnerability Surfacing: Keeping on top of your security landscape is more important now than ever. Comper’s security findings, dependency advisories, and CVE drill-downs are now surfaced right on the main repository view, complete with deep links to affected files, meaning you can keep on top of any security risks, hidden in your code
Engineers: Focus on your (team) assigned pull requests, immediate security vulnerabilities, and owned repos without notification noise. Develop securely and safely at speed
Product Managers: Get instant automated summaries of shipped capabilities and current release progress per milestone.
Engineering Leadership & CPOs: Monitor organization-wide productivity trends, churn ratios, and security posture at a glance.
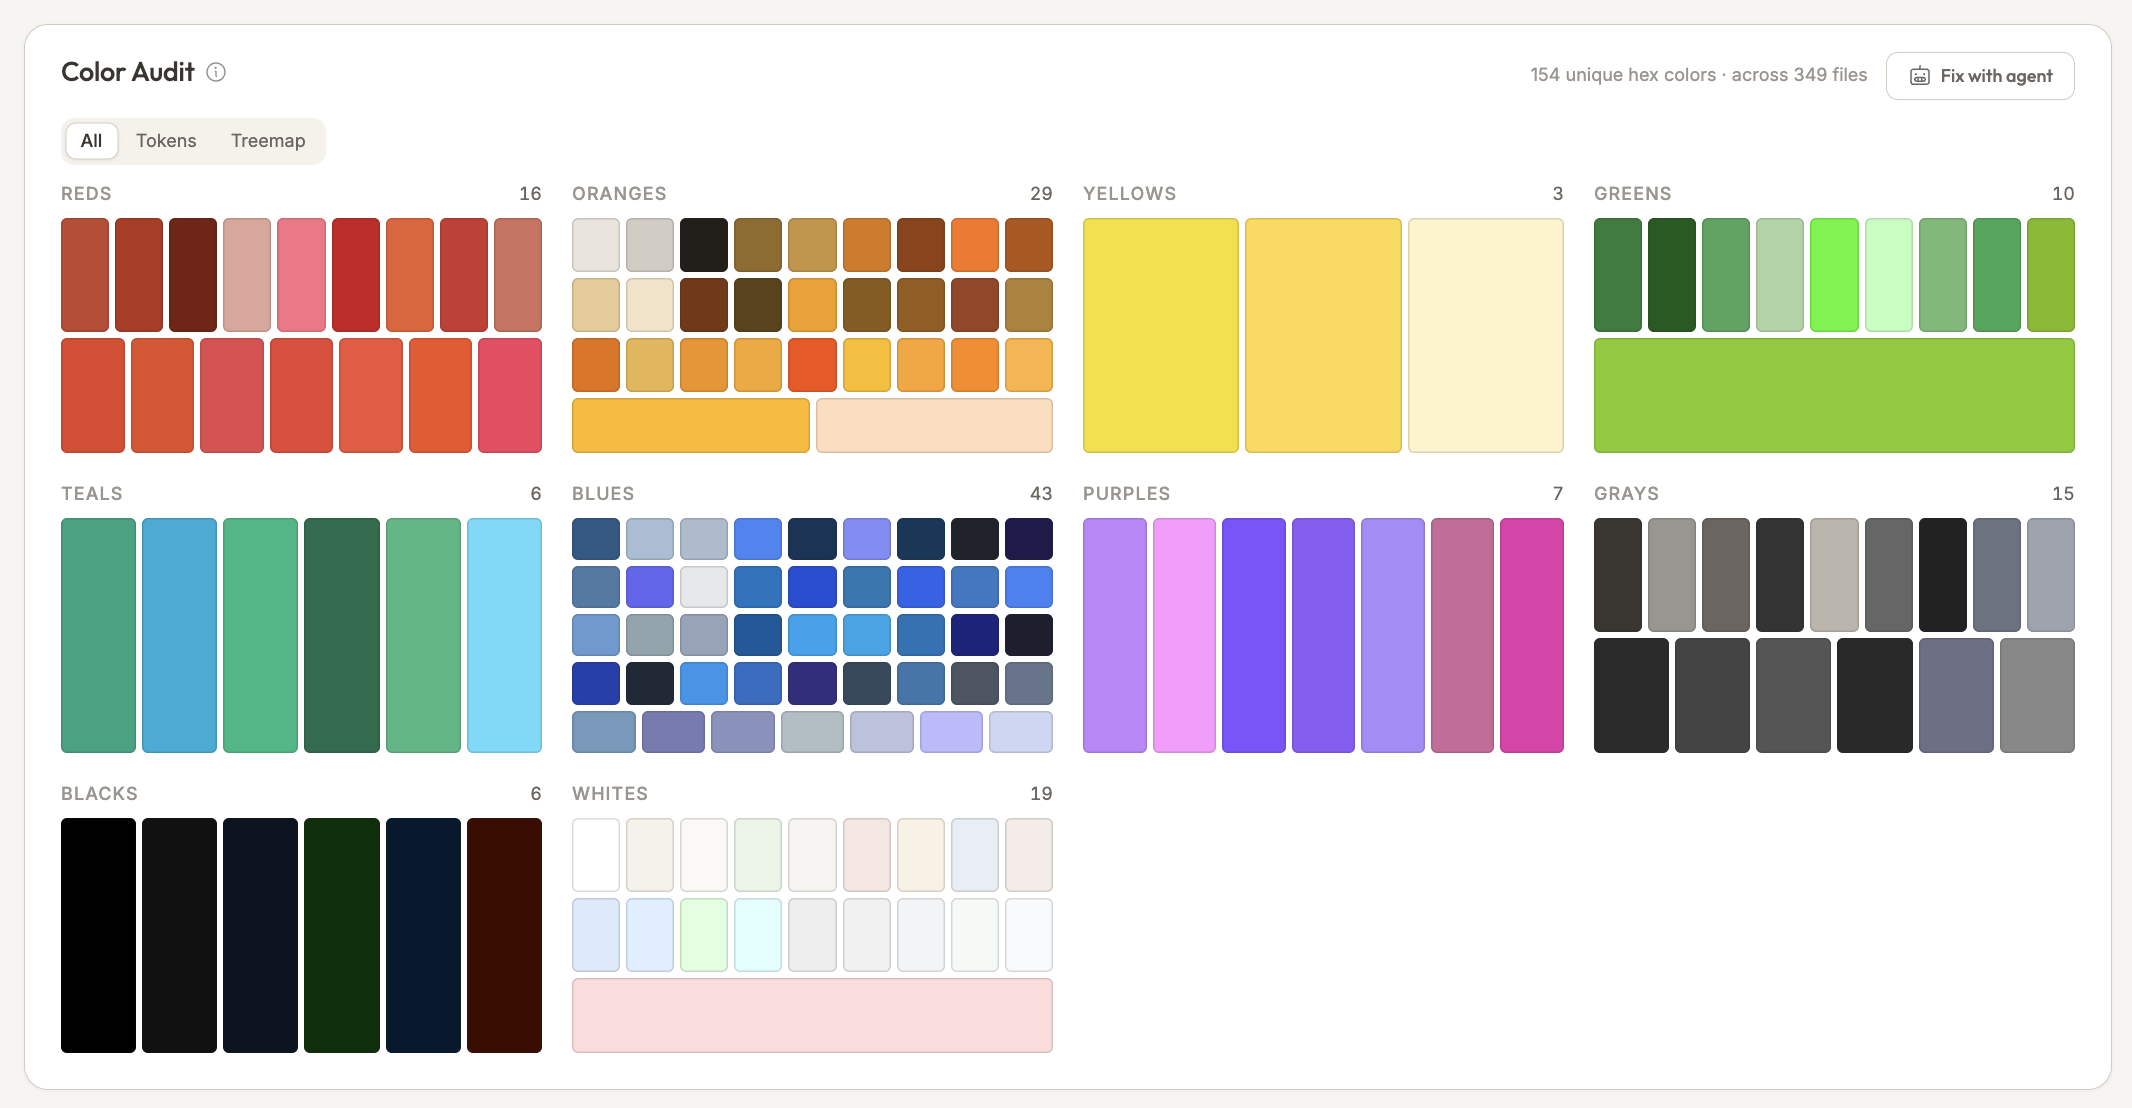
Coming soon: UI Insights: Design System Audits
Design system consistency is notoriously difficult to maintain across distributed frontends. Over the last month, we introduced dedicated design and style audit widgets (in beta) directly inside your repository analytics.
Engineers: Automatically identify off-brand UI components and apply automated fixes via the agent directly in your editor.
Product Managers: Ensure visual and brand consistency across distinct feature teams without endless manual QA checks.
Engineering Leadership & CPOs: Track design system adoption rates across all repositories to maximize frontend engineering efficiency.
All of these features are available starting today across your Comper workspace. Open your board to explore your updated living diagrams, test out the Change Request Agent on your next pull request, or dive into the Product Flows dashboard